


Real Life Math: Benford's Law
In this article, we are going to look at a phenomenon that concerns the numbers you come across every day. Here is its name: Benford's law.
A law that you come across every day
Open a magazine or newspaper - this would work with a book, but I think there are books without numbers, so let's stick to magazines and newspapers. Look at the numbers you find and look at the first non-zero digit of each number you come across. So that first number should be between 1 and 9. Write these numbers down in a corner. What are the results? Your intuition is probably telling you that you should see each number with about the same frequency.
Normally, if all goes well, you should have quite a few more 1s than the other numbers. This is Benford's law! A rounding off issue? Not even!
Intuition of the result
If you pick up a lot of numbers, you should have more 1's than 2's than 3's ... with the 9 slightly less represented at the end.
Let's try to understand intuitively why we find this result. The reason is the following: it is more complicated to go from 1 to 2 than from 2 to 3. Then it is more complicated to go from 2 to 3 than from 3 to 4. The same goes for the other numbers. Now what do we mean by "more complicated"? You have to see it from the side of the progression of the numbers. To go from 1 to 2, you multiply by 2. Whereas to go from 2 to 3, we have to multiply by 3/2, then 4/3, ... It is this decrease which makes that we find more 1 than 2.
This is something that can be seen on the logarithmic scale: as the first number increases, the size decreases. This is the phenomenon that we encounter in our daily lives.

Statement of Benford's Law
The formula is as follows: the frequency of appearance of the digit i for i between 1 and 9 is as follows:
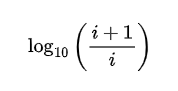
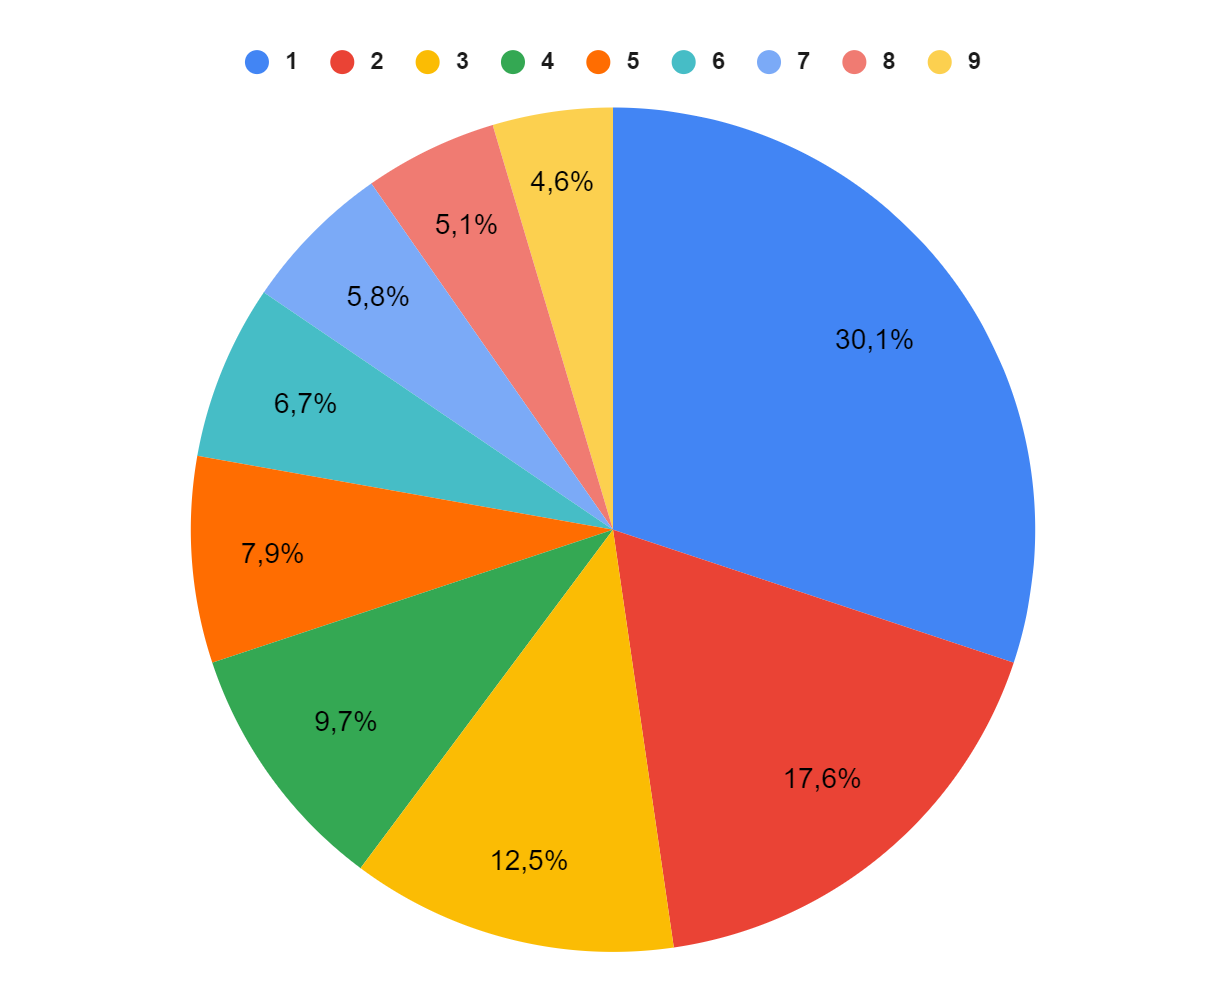
This formula then gives us the following distribution on the graph: 30.1% chance of having 1, 12.5% chance of having 2, up to 4.6% chance of having 9.
In the days when calculators were not used, or were only rarely used, logarithm tables were used to determine their values. It was noticed that the first pages, those on the 1 side, were more damaged than those on the 9 side. A first article on this subject was published in 1881 by Newcomb. It took more than 50 years for Benford to finally demonstrate this law, which bears his name.
To have more chances that this law works, it is better that the data used is as varied as possible. Indeed, if you are interested in sizes of people, you will have a frequency of 1 exceeding 30%. This law will therefore work either if the data are from various sources, or if they are spread over several orders of magnitude. This is not the case for sizes because they are on a small range.
Benford's law also has a use: it allows to detect fraud. Randomly generated numbers will not follow this law and can therefore be used to detect falsified data.
.png)

